The below blog provides various exploratory analysis on the dataset to get insight on data. As an example, I have taken the Titanic dataset from Kaggle ( Titanic DataSet )
The code is generalized for other dataset also. You can use the script for other dataset with minimal changes.
The complete python code is available in my github
Download the code from github and run the pyton script.

Output Generated
Sample output is uploaded to output folder.
1) 1_initial_data_analysis.txt
Provides an overview of No# of Attributes, Name of the Attributes, Type of Attribute, Mean/Max/Range for each Attributes, Attributes with no# of missing values, Possible categorial Attributes, Unique value for these categorial values etc.
Instance Count :  891
Attribute count (X,y) :  12
Attribute Names (X,y) :  ['PassengerId', 'Survived', 'Pclass', 'Name', 'Sex', 'Age',
'SibSp', 'Parch', 'Ticket', 'Fare', 'Cabin', 'Embarked']
Most likely cataegorial values : ['Survived', 'Pclass', 'Sex', 'Age', 'SibSp', 'Parch', 'Embarked']
Most likely **Non cataegorial values : ['PassengerId', 'Name', 'Ticket', 'Fare', 'Cabin']
Sum of Missing Values for each attributes :
PassengerId 0
Age 177
Cabin 687
Embarked 2
Unique values for cataegorial column : Survived [0 1]
Unique values for cataegorial column : Pclass [3 1 2] Refer the file for detailed output.2) Histogram and Box ploting of all attributes in a single image to get the overall view of data
 | |||
| Histogram plotting of all Attributes |
 |
| Box plotting of all Attributes |
3) Ploting the Density and box plot with various additional information on catagorial attributes
 |
| Plotting of Attributes - Age |
 |
| Plotting of Attributes - Fare |
You can refer the ploting for other catagorial attributes under output/4_*_density_box_plot.png
4) Ploting the Categorial Attributes grouped by Target Attribute
 |
| Plotting of Age grouped by Survived |
 | ||
| Plotting of Pclass grouped by Survived |
You can refer the ploting for other catagorial attributes under
output/5_*_GroupBy_Survived_Histogram_plot.png
5) Pairwise plotting of Attribute
 |
| Pairwise plotting of Attributes |
6) Ploting the Attributes by generalized values
 |
| Ploting Age_group |
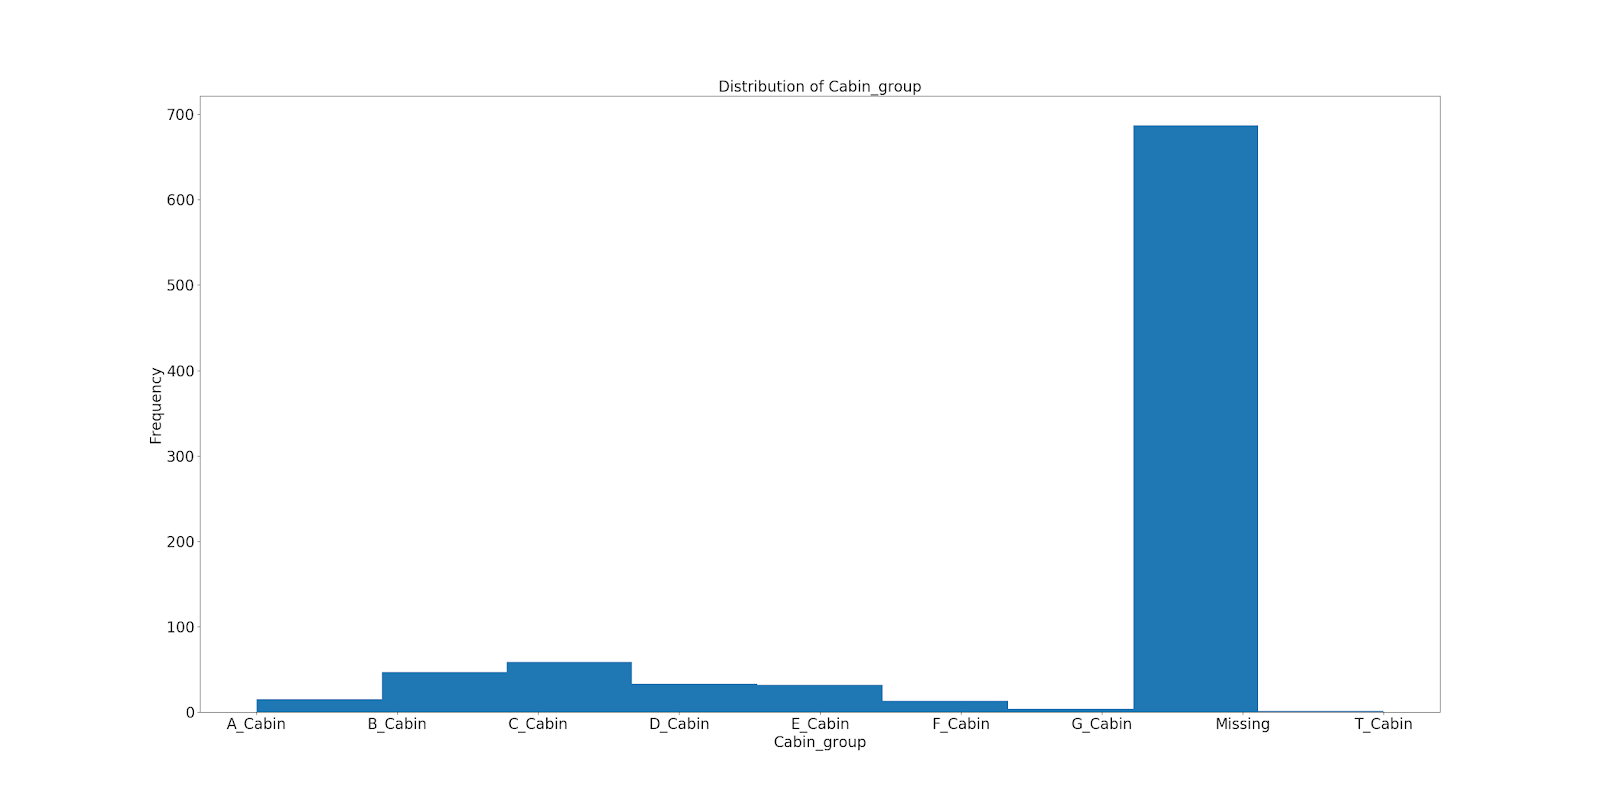 |
| Plotting Cabin_group |
7) Ploting generalized Attributes with respect to Target attribute
 |
| Ploting Age_group with Survived |
 |
| Plotting Cabin_group with Survived |
8) 9_GroupBy_Attribute_based_on_Target.txt
The file records provides the count of each attribute with respect to Target attribute.
Group by on Attribute : Sex
Dictionary Mapping : {'male': 0, 'female': 1}
    Sex  count  Survived
    0    0    468         0
    1    0    109         1
    2    1     81         0
    3    1    233         1

Group by on Attribute : Age_group
Age_group  count  Survived
    0       0-10     26         0
    1       0-10     38         1
    2      10-20     71         0
    3      10-20     44         1
    4      20-30    271         0
    5      20-30    136         1
    6      30-40     86         0
    7      30-40     69         1
    8      40-50     53         0
    9      40-50     33         1
    10     50-60     25         0
    11     50-60     17         1
    12     60-70     13         0
    13     60-70      4         1
    14     70-80      4         0
    15     70-80      1         1
Refer the file for other attributes.
The file records provides the count of each attribute with respect to other attribute.
Frequency with respect to Pclass and Fare_group
Pclass  Fare_group
    1       0-50           77
            50-100         86
            100-150        24
            150-200         9
            200-250        11
            250-300         6
            500-550         3
    2       0-50          177
            50-100          7
    3       0-50          477
            50-100         14


Frequency with respect to Sex & Embarked
Dictionary Mapping : {'male': 0, 'female': 1}
Dictionary Mapping : {'S': 1, 'C': 2, 'Q': 3}
Sex  Embarked
0    1           441
     2            95
     3            41
1    1           205
     2            73
     3            36
Refer the file for other attributes.
10) Ploting the Categorial Attributes with respect to other Attributes
 |
| Plotting the Fare group & Embarked |
 |
| Plotting the Pclass & Fare group |
You can refer the ploting for other catagorial attributes under output/10_CrossAttributeAnalysis/2_CrossAttribute___Count.png
11) 1_CrossAttribute_Target_data_analysis.txt
The file records provides the count of each attribute with other attribute along with target attribute
Frequency with respect to Pclass & Sex & Survived
Dictionary Mapping : {'male': 0, 'female': 1}
Pclass  Sex  Survived
1       0    0            77
             1            45
        1    0             3
             1            91
2       0    0            91
             1            17
        1    0             6
             1            70
3       0    0           300
             1            47
        1    0            72
             1            72


Frequency with respect to Sex & Embarked & Survived
Dictionary Mapping : {'male': 0, 'female': 1}
Dictionary Mapping : {'S': 1, 'C': 2, 'Q': 3}
Sex  Embarked  Survived
0    1         0           364
               1            77
     2         0            66
               1            29
     3         0            38
               1             3
1    1         0            63
               1           142
     2         0             9
               1            64
     3         0             9
               1            27
Refer the file for other attributes.
12) Ploting the Categorial Attributes with respect to other Attributes and Target Attribute
 |
| Plotting the Pclass & Age group & Survived |
 |
| Plotting the Pclass & Fare group & Survived |
You can refer the ploting for other catagorial attributes under output/11_CrossAttributeWithTargetAnalysis/2_CrossAttribute___Survived.png
The python code is generalised so you can use it for any dataset. The complete code is available in github.
No comments:
Post a Comment